Foray into Crypto Stat Arb- ETH, SOL and BTC

Hello! After experimenting with factor strategy, I have moved to learning about statistical arbitrage.
So what's statistical arbitrage? It's a strategy that profits from pricing inefficiencies between related assets. Trivially, we require the spread between the price of two assets to be mean reverting. When the spread is too high, it implies that either asset A is overpriced relative to asset B, or asset B is underpriced relative to asset A. In such a case, we short the overpriced asset A and long the underpriced asset B. It's the opposite when the spread is too small- we long the underpriced asset A and short the overpriced asset B.
Can altcoins be statistically arbitraged?
I started by testing on ETH/SOL pairs. These are assets that are competitors, mainly as L1s for programmable money. I fetched 1000 hours of data from Binance, and conducted the Augmented Dickey-Fuller test to check if the spread between ETH and SOL prices is stationary. The p-value was 0.3731, which suggested that the log of the spread was non-stationary.
I also plotted autocorrelation analysis using Autocorrelation Function (ACF) and Partial Autocorrelation Function (PACF).
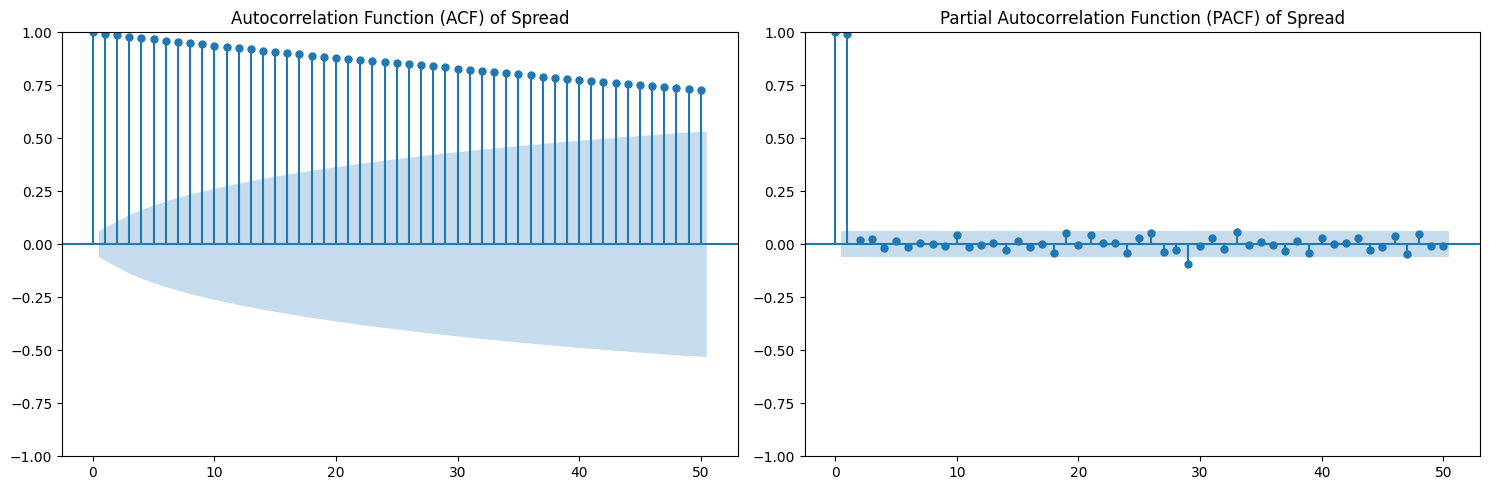
As we can see, the ACF plot decays linearly, which further reinforces the notion that ETH/SOL's spread is not stationary.
Wrapped tokens- BTC/WBTC
Given that competing L1s in ETH/SOL are non-stationary, I decided to move on to wrapped tokens, specifically WBTC.
The p-value for the pair spread between BTC/WBTC was 0.0029, which was enough to reject the null hypothesis.
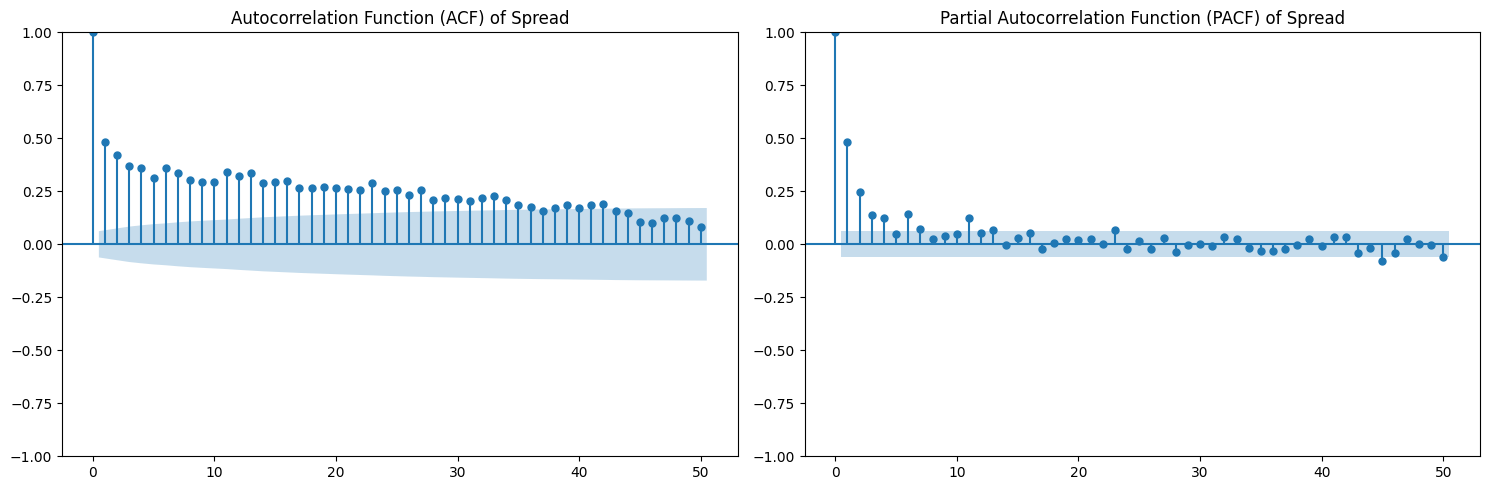
Our ACF and PACF plot also show that an autoregressive model of order 4 could be suitable in modelling the spread.
Modelling- ARMA and GARCH
We primarily used an autoregressive model, which used the previous time values to predict the next time value. We set q=0 for the moving average component of an ARMA model as our ACF plot decays slowly, suggesting that past errors are not the primary driver of the next value.
In addition, we needed to conduct testing for volatility clustering. The crux is simple- deviations from our predicted prices may not be just white noise. Rather, they could be due to volatility in the market (e.g. unexpected news announcement). It is common to see in the markets where a choppy day is followed by periods of more choppy days, and vice versa.
We run Ljung-Box test on the squared residuals to see if the squared residuals are correlated with their own past.
By using a AR(4)-GARCH(1,1) model, we are able to model both the spread action and also factor in the forecasted volatility.
Backtesting
I set up my backtesting with these parameters:
- Trading Window Size: 500 hours of data to fit a model
- Fee per leg: 0.1% (standard Binance spot fee)
- Entry and exit Z scores of 1.5 and 0.5 respectively
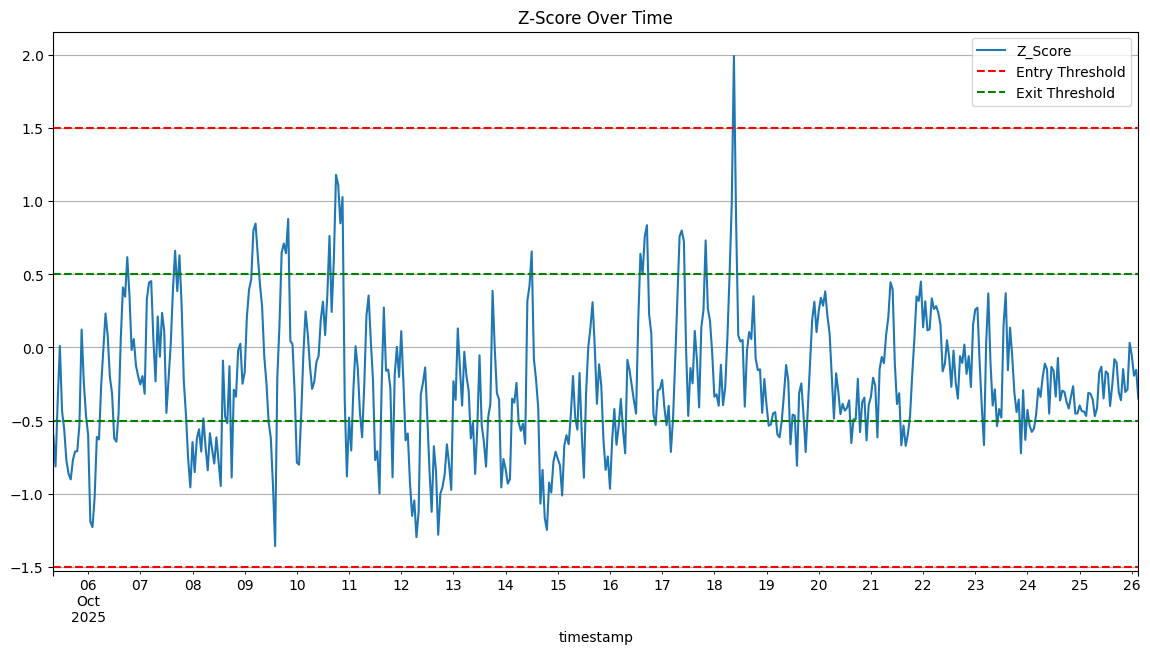
Unfortunately, we can see that there was only 1 deviation in spread that triggered our trade in about 3 weeks. In addition, this was a losing strategy as the market moved against us.
Learnings
I believe the edge in statistical arbitrage exists in asset classes where the big players have not moved in. This can often be new assets or exchanges.
I'll keep an open mind for these opportunities while continuing to learn more about quant strategies!
